
One of the most important features of the Web interface is the ability to create reports. Many larger companies need reports to allow them to take decisions at a higher management level.
Reporting functionality can also be used to browse historical notifications to alerts, and to see complete logs for a specified period.
Nagios offers the following types of reports:
- Trend reporting for host or service: Shows the state changes history for a ingle object along with the status information from performed checks
- Availability report for hosts or services: Shows how much time an object has spent in a particular status; can report on all objects or a single object; can also generate reports for host groups and service groups
- Alert histogram: Shows the number of alerts that have occurred over a period of time for a particular host or service
In addition, Nagios can report a history of alerts, notifications, or all events. This can be considered as reading Nagios logs in a more convenient way. It allows you to read the history either for all hosts and/or services, or for a specific object. The reports are also formatted in a more readable way than the raw logs.
Generating most reports begins with choosing the report type, then the object type-host, host group, service, or service group. Then either all objects, or a specific object, is chosen for which a report is generated.
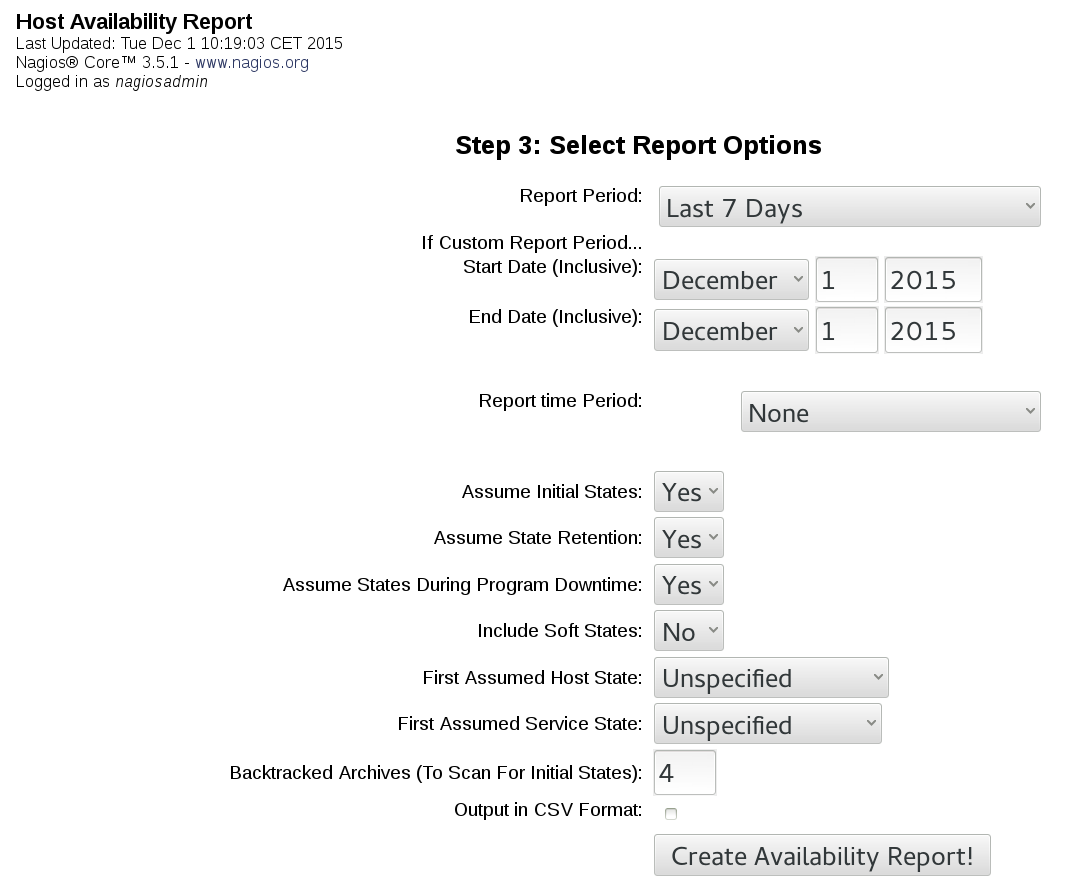
Next, you need to specify the period for which a report, should be generated, along with additional options that can depend on the type of report being be generated. Additionally, a time period can be specified, so that the report only includes specifictime periods, such as working hours.
The following is a screenshot of a sample form for specifying the parameters for a report. The actual fields may vary depending on the type of report that you want to generate.
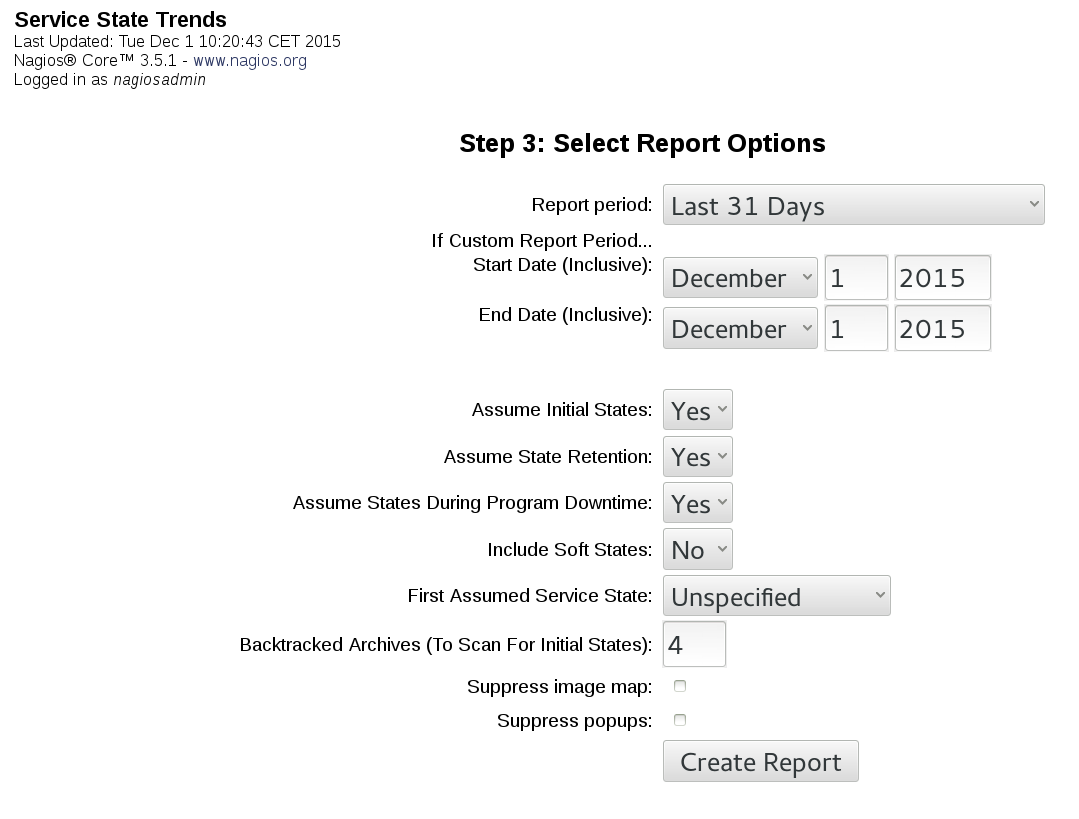
The following screenshot shows how to generate trend report. It shows the state changes history for a ingle object along with the status information from performed checks.
After specifying the parameters in the form, and submitting it, the web interface will generate a report matching your criteria. Some types of reports also allow you to export the information in CSV format for further analysis. For a trend history report, it is also possible to zoom in or out in order to customize the period for which the report is generated.
The following screenshot shows the availability report for all hosts. It shows how much time each host has been up, down, or unreachable due to the parent machines not being up.
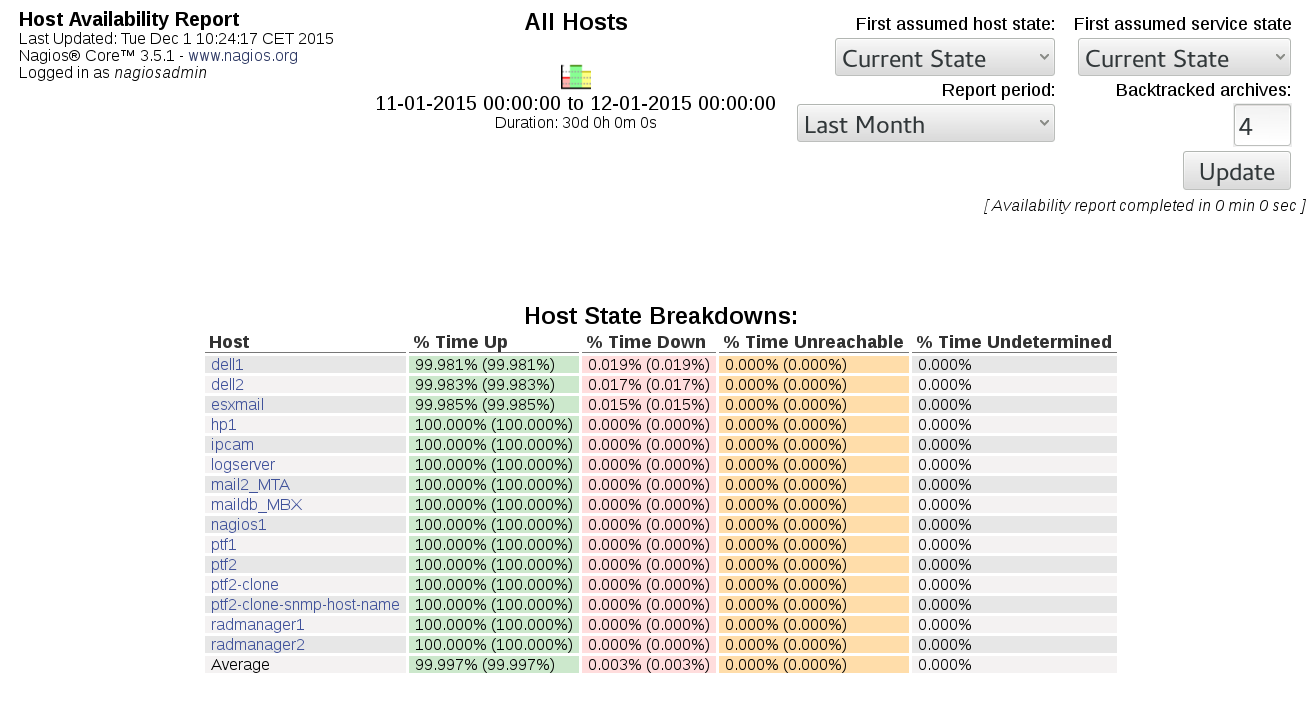
The report shows information for all hosts, in a table, along with a summary of the overall availability.
It is possible to change the parameters of a report after it first has been generated, to modify the reported period or the information included on the report.